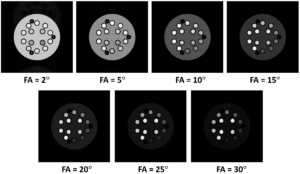
The NIST phantom was imaged using 3D RF spoiled gradient echo sequences with various flip angles (2, 5, 10, 15, 20, 25 and 30 degree). TR = 18 ms, TE = 6 ms, image matrix = 256 x 256 x 256, number of subvoxels = 256 x 1 x 1. The following images show coronal cross sections of the T1 array: T1 of water proton in the spheres are 1989, 1454, 984.1, 706, 496.7, 351.5, 247.13, 175.3, 125.9, 89.0, 62.7, 44.53, 30.84, 21.719 ms, respectively.
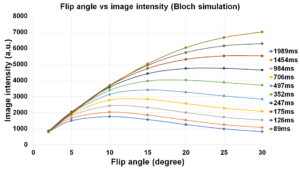
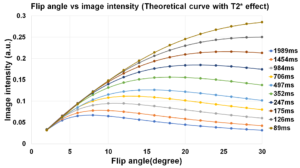
The following graphs show flip angle dependence of the image intensity for the T1 array spheres (T1 = 1989 – 89 ms). The image intensity measured for the simulated images reproduced the intensity calculated using the theoretical equation:
I ∝ sinθ*(1-exp(-TR/T1)/(1-cosθ*exp(-TR/T1))*exp(-TE/T2) (θ: flip angle).